Did the marketing team ever asked you “how many users can the service handle ?”
Or maybe an investor asked you how the platform can scale ?
Or you’re preparing for a traffic peak and want to check how the application perform under a higher load ?
Well, it happened to us quite a few times, in this article we’ll see how we perform load testing to answer this question.
What do we want to learn :
First you need to define precisely what do you want to measure. In our case it was : “as of today, how many users can use the service at the same time, with a great user experience in terms of response time.”
It means that we will not modify (or improve) our code or infrastructure during the test. If we find some bottleneck and have some ideas on how to solve them we will write them down and work on it only after the load testing project is over. The only modification to our service that we allow is adding more servers. Since we are on Heroku it means adding more Dyno which can be done in minutes. We also decided that requests served in more than 1s would be considered as an error.
To do this test we wanted to simulate the traffic we currently have on our API. After inspecting our traffic in new relic we see that we have the highest throughput on week end, between 8pm and 12pm. What we are going to do is simulate the typical traffic to our API during this peak load and multiply it until our service goes down or response time goes below 1s.
Choosing a load testing tool
In our case we need a load testing tool that allows to create complex scenario that reproduces a typical user behavior. We short listed 2 tools with advance features to create complex scenario :
We chose Jmeter for its advanced scenario recording features : you can start a local proxy and record requests made from a browser or mobile device. There are also great tools to distribute the load test on EC2 (more on that later)
Some SaaS service exists to make the load testing process even easier. Blazemeter seems great but is not cheap.
Define a load testing scenario
Jmeter alllows you to increase the number of thread running the recorded scenario. But a JMeter thread is different from a user. A typical user session would last between 5 and 30minutes, whereas each thread executes the recorded session in a bout 5 seconds.
In order to get an estimation of the number of users corresponding to the number of thread there are 2 solutions :
-
you can add a constant timer which will pause the thread between each request, this way the number of threads would become similar to a number of concurrent user
-
Or, based on the number of requests per minute on your service and the number of concurrents users reported by google analytics, you can estimate how many concurrent user you are simulating with a single thread.
solution 1 : Add a constant timer
I) Pros :
If you manage to setup a realistic delay between request, then uou can get to a point where 1 thread = 1 user. It helps interpreting the results.
II) Cons :
This delay will be very specific to your application : “click” behavior will not be the same on a news website, compared to a SaaS service, compared to an online game. Since you can’t use a standard delay (lets say 2s), how do you know the average delay between requests for your website ? You could probably make a guess by dividing the average session duration with the rpm, but if you go down that path, you should as well go directly to solution 2.
This approach will require a lot more thread, by slowing down the test scenario with delays you will probably need between 10x to 100x more threads to simulate a high load. Which means you’ll have to distribute your test across more instance, it will cost more and it will increase the overall time and complexity (spinning 100 instances is not the same as 10 : failing instances, waiting for all instances to be ready, aggregating logs, etc)
Solution 2 : Estimate the number of concurrent users simulated by a single thread
I) Pros:
With this approach each thread will perform a lot more requests, you’ll need fewer instances to perform your test, wich means it will cost you less and a more simple test. It’s also easy to calculate roughly how many users each thread represent.
II) Cons :
A thread is no longer equivalent to one user, you have to convert a number of rpm to a number of users which makes the results harder to analyse.
We decided to go with this approach : We have a peak load every week end around 8pm : lets say our app receives around 1000 requests per minute. At the same time lets say google analytics (web + mobile) reports about 200 simultaneous users.
Therefore 1 user is generating 5,33rpm
In order to record a realistic scenario we tried to reproduce the API usage new relic reports. The throughput for each API endpoint looked like :
30% api endpoint 1
15% api endpoint 2
Etc
We then recorded a test scenario that reproduces these ratios.
Recording a realistic scenario with JMeter
Recording a user session is easy, just follow this tutorial
Well, the happy path is quite simple, but in our case we had to do some troubleshooting.
Troubleshooting : XHR requests failed because of CORS
Cross-origin resource sharing (CORS) is a mechanism that allows many resources (e.g. fonts, JavaScript, etc.) on a web page to be requested from another domain outside the domain from which the resource originated http://en.wikipedia.org/wiki/Cross-origin_resource_sharing
When running the jmeter scenario XHR requests fail with message : Cross-Origin Request Blocked: The Same Origin Policy disallows reading the remote resource at https://api.youboox.fr/api/v3/selections.json?per=3
First you we checked that the staging server was sending proper Allow-Origin in the headers, evrything was ok. Then we figured out the problem was coming from HTTPS : the certificate wasn’t verified and the proxy was droping the headers…
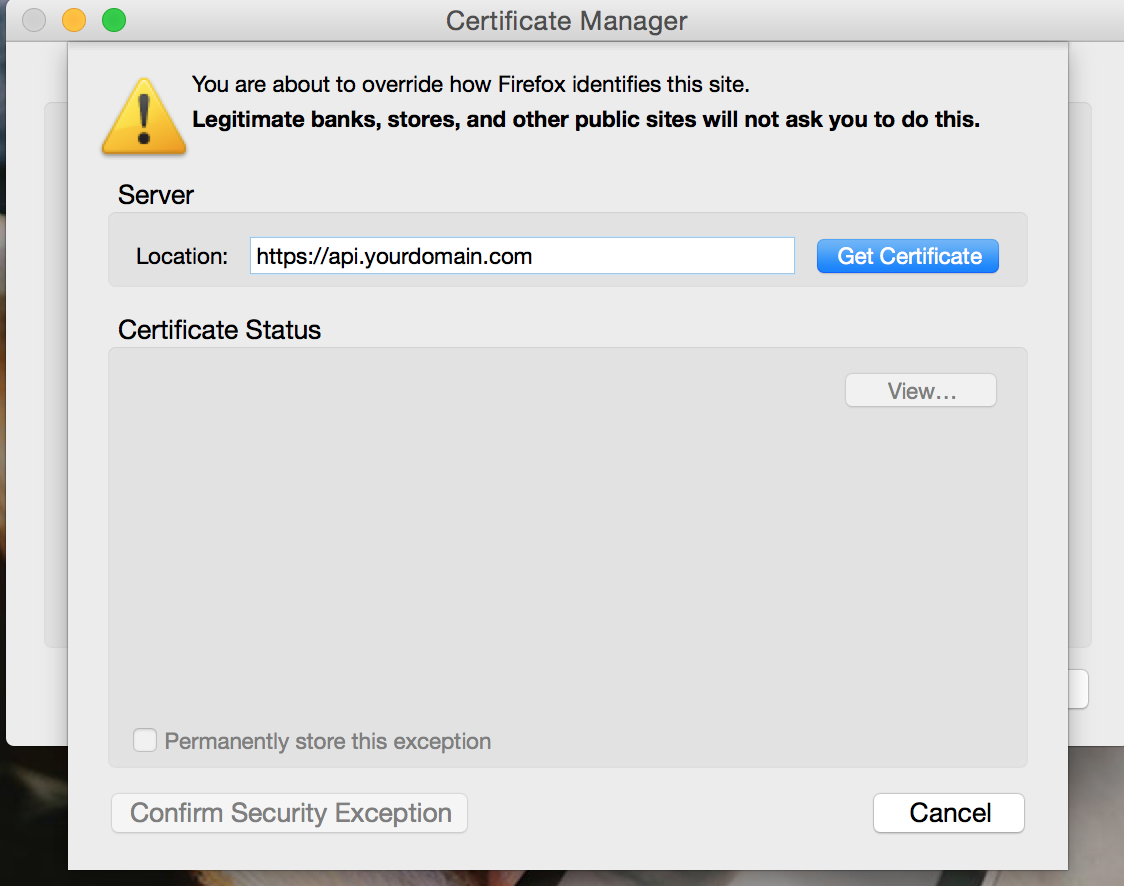
To solve this issue :
- Open firefox preferences
- Go to certificates > view certificates > servers
- Add an exception for all https domain you’re using, ex :
api.yourdomain.com
Cloudfront
Etc
Advice when recording the scenario :
Only record traffic to your API, this will make your test faster to run. It will also prevent you from additional cost if some of the requests are made against paid services (ex: Cloudfront)
In jmeter user the “URL to include” option to filter requests, you can use the following syntax:
``` .api.yourdomain.com ``
In order to have more realistic results you should run your test for at least a few minutes Especially if you distribute your load test on EC2, your paying by the hour, so why not fukky use it, set 30 to 45min test.
Requests to your API probably include a session token for authentication, and it probably expires after some time. Before running your Jmeter test you’ll need to set the token that was used when you recorded the scenario.
Beware that by doing that your test simulates a single user making a very large number of requests. This might introduce artificial bottleneck depending of your use case. Imagine you’re keeping some sort of counters for this user, this can lead to a situation where you’re heavily reading and writing to the same row in your database and create lock problems.
That’s exactly what happened to us. We’re using Postgres, so i don’t really know why this happened, maybe read where queued behind write for consistency ? Postgres is supposed to read and write concurrently by default)
To avoid this problem we randomised the token used. Since you also need to set these token in your session cache you could limit your random token to a smaller range and set all of them in your cache.
Setup load testing environment on Heroku
When running a load test what you’re doing is basically a DDoS attack. You probably dont want your service to go down while load testing.
We used our staging environment that we temporarily scaled up to mimic our production environment during the test. And scale it down when the test ended so you don’t double your infrastructure cost
Additionaly we had to make a few modification to our setup on the staging environment, here are some example you should consider :
- Disable rate limiting by IP on our API
- Disable timestamp check when we verify API request signature
- Set rack timeout to 1s : it’s easier to return 4xx when our application starts to struggle under load, it allows us to look at error rates to decide if the test is failing.
Running the load test from local machine
When running the test from our laptop against our staging app we were quickly rate limited, at about 2000 rpm our app stopped receiving our requests :
Response code: Non HTTP response code: org.apache.http.conn.HttpHostConnectException
Response message: Non HTTP response message: Connection to http://staging-app.herokuapp.com refused
The requests either didn’t reach Heroku (throttled by our isp or some proxy along the way ?) or Heroku rate limited us (they mention a DDoS protection in their doc)
To overcome this IP limitation we needed to distribute our requests across several EC2 instances
Distributing the test on multiple remote servers with EC2
Jmeter can run a test on multiple servers, see this document
The problem is that when you run a lot of instances they are all sending logs to your master which becomes a bottleneck :
Having a central data feeder was a problem. Using JMeter’s master node is impossible. A single shared data source might become a bottleneck source
To avoid that you can use jmeter-ec2 . This script is great, it allows you to distribute your load testing on multiple EC2 instances. It was using only on demand EC2 Instance, running a load testing is a perfect use case for spot instances (Read more about spot instances)
I added support for spot instances to jmeter-ec2, feel free to suggest improvements.
Steps to use the script :
- You’ll need
aws -cli, just follow these steps - To start the script, just follow this tutorial
Reading results from the test
When distributing the test you are producing a large volume of data. Even with a few micro instances during a few minutes you’ll face memory issues when opening the test results in jmeter.
First of all be carefull about the listeners you add to your Jmeter test :
Listeners can use a lot of memory if there are a lot of samples. source
Then you can tune how Jmeter will record results to reduce memory usage
And of course you should increase the RAM allocated to the JVM. To do so edit the file /usr/local/Cellar/jmeter/2.12/libexec/bin/jmeter.
And set HEAP="-Xms12288m -Xmx12288m"
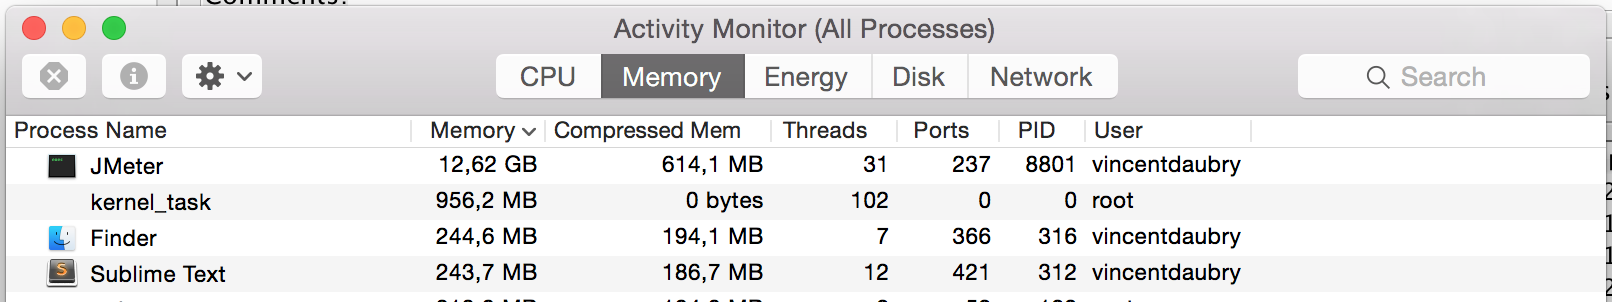
Even after these improvements Jmeter uses 12Gb of RAM and still gives outOfMemory errors, even with my 16Go mac book pro i can’t display my test results…
Hopefully Blazemeter offers an online a free visualisation tool for Jmeter. You can upload your.jmx files on their service called loadosophia
Conclusion
If you don’t add a constant timer delay to your test scenario, you can first simulate traffic from a simple laptop. For that jmeter is a great tool : you can easily record a realistic test scenario and replay it later.
If you need to simulate a higher load or if you need to send requests from multiple ip then you’ll need to distribute your test across several servers. To distribute the test on multiple remote servers, jmeter-ec2 has been the perfect tool for us.